╣ż│╠|ę╗Į© Č■Į© įņārĤ ▒O(ji©Īn)└ĒĤ ū╔įāĤ ░▓╚½Ä¤ ĮY(ji©”)śŗ(g©░u)Ĥ ╣└ārĤ įņāråTĪĪĢ■ėŗ| Ģ■ėŗūC Ģ■ėŗ┬ÜĘQ ūóĢ■ Įø(j©®ng)Ø·(j©¼)Ĥ ČÉäš(w©┤)ĤĪĪßt(y©®)īW(xu©”)| ąl(w©©i)╔·┘YĖ± ßt(y©®)Ĥ ╦ÄĤ [Ė³ČÓ]
Writing 8
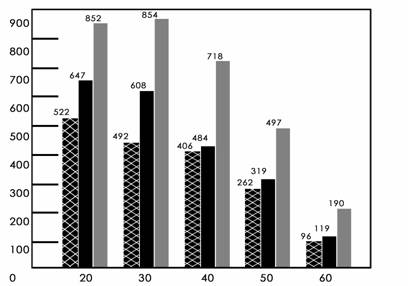
Estimated Earnings in City X
Outline:
1. Earnings and different ages.
2. Earnings and different education levels.
3. Draw your own conclusion.

As is illustrated in this chart, there is a close link between the earnings and ages. On the average, people at the age of 30 get the highest incomes. The incomes of the people, who are about 20 years of ages, are almost at the same level. The earnings of the people from 40 to 60 years old drop sharply. People at the age of 60 can earn only about 1/5 the incomes of the young.
If we take a closer look at the relationship between the earnings and the education levels, we can find that the higher education one gets, the more money one can earn.
From the above analyses, I would say we have to make our greatest efforts to get more education to make more money. Meanwhile, when we are young, we should set aside some money to be used later when we are too old to earn much money.
Useful Expressions and Structures:
ĮķĮBłD▒Ē
As is shown/described/illustrated/indicated/revealed in the cartoon/picture/graph/chart/table, ...
As can be clearly seen from the cartoonĪŁ
What a vivid picture it is! It tells us thatĪŁ
According to the table..., As can be seen from the table..., It can be seen from the table...
It is self-evident thatĪŁ, It goes without saying thatĪŁ, There is no denying the fact thatĪŁ
Įy(t©»ng)ėŗöĄ(sh©┤)ō■(j©┤)Ą─▒Ē▀_(d©ó)ĘĮĘ©
increase/fall slightly/a little/sharply/dramatically/drastically from...to..., skyrocket/soar/rise/ decline/jump fromĪŁtoĪŁ
remain steady at..., level off atĪŁ, peak at..., reach the climax at..., reach the low atĪŁ, account for...
twice/three... times as many/much as..., one fifth/a quarter/a third/a half of...
öĄ(sh©┤)ō■(j©┤)ūā╗»Ą─▒Ē▀_(d©ó)ĘĮĘ©
The number/amount of...increased/jumped/rose/decreased/dropped/fell/ suddenly/rapidly/ dramatically/ sharply/ steadily/ gradually/ slowly/slightly from...to...
There was a sudden/rapid/dramatic/significant/sharp/steady/gradual/slow/slight increase/jump/rise/ decrease/drop/fall in the number/amount of...from...to...
ķ_Ņ^║═ĮY(ji©”)╬▓Ą─│Żė├Šõą═
The two graphs describe the same thing seen in two different ways. The first diagram simply recordsĪŁThe second graph throws a new light onĪŁ
The key findings taken from the surveys are as follows:ĪŁ
This table provides several important points of comparison between A and B.
| ▒▒Š® | ╠ņĮ“ | ╔Ž║Ż | ĮŁ╠K | ╔Į¢| |
| ░▓╗š | šŃĮŁ | ĮŁ╬„ | ĖŻĮ© | ╔Ņ█┌ |
| ÅV¢| | ║ė▒▒ | ║■─Ž | ÅV╬„ | ║ė─Ž |
| ║Ż─Ž | ║■▒▒ | ╦─┤© | ųžæc | įŲ─Ž |
| ┘Fų▌ | ╬„▓ž | ą┬Į« | Ļā╬„ | ╔Į╬„ |
| īÄŽ─ | Ė╩├C | ŪÓ║Ż | ▀|īÄ | ╝¬┴ų |
| ║┌²łĮŁ | ā╚(n©©i)├╔╣┼ |